Project Summary
The Finance & Analysis Dashboard is a powerful, data-driven platform designed to give business leaders a comprehensive view of financial performance across revenue, profitability, cash flow, KPIs, and operational trends.
The platform ingests financial data from multiple sources (Excel imports, bank feeds, OCR receipt processing), calculates complex KPIs, and uses AI to generate actionable insights and business summaries. It's designed for business owners and CFOs who need to understand their financial position quickly and make data-driven decisions.
Business Problem
Most businesses struggle with financial visibility:
- • Data scattered: Financial data lives in spreadsheets, accounting software, and bank portals
- • Manual analysis: CFOs spend days building reports and analysis manually
- • Delayed insights: By the time reports are ready, the data is old
- • No actionable guidance: Numbers are reported but insights are missing
My Role
Product Designer & Technical PM: I worked with stakeholders to define the dashboard's structure, user workflows, data models, and feature priorities.
Full-Stack Developer: I designed and implemented the financial KPI engine, data import workflows, OCR integration, AI analysis pipelines, and the interactive dashboard interface.
Architecture & Technical Approach
Data Ingestion Pipeline
The dashboard accepts financial data from multiple sources: Excel uploads with transaction records, CSV imports from accounting software, receipt images processed via OCR, and bank feed integrations. Each data source is normalized into a standard format for analysis.
KPI Engine
A sophisticated KPI calculation system computes financial metrics (revenue, profit/loss, margins, burn rate, cash flow, client acquisition cost, lifetime value, etc.) at multiple time scales (daily, monthly, quarterly, yearly). Historical comparisons enable trend analysis.
AI Analysis Layer
AI workflows analyze the financial data and KPIs to generate summaries, identify anomalies, suggest insights, and provide recommendations. This moves the platform beyond reporting to actionable intelligence.
Interactive Dashboards
React-based dashboards with charts, tables, and export tools allow users to explore data, drill down into details, and share reports. Dashboards are customizable to different roles and needs.
Dashboard Interface
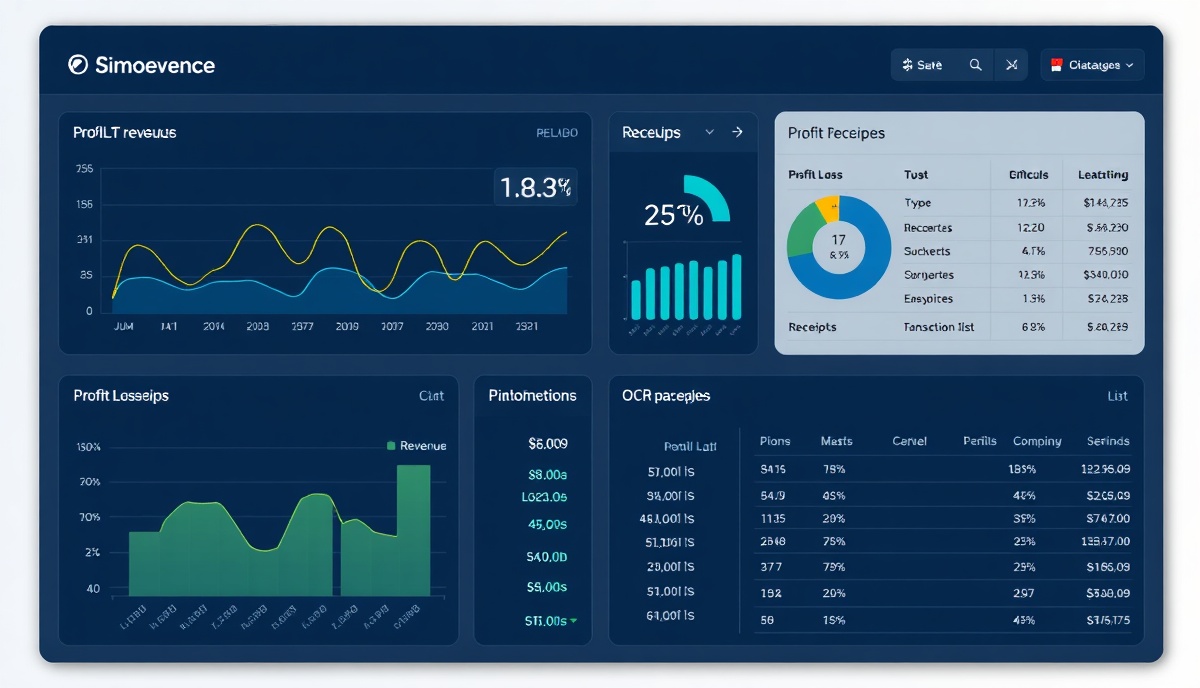
The dashboard provides real-time visibility into financial performance with interactive charts, KPI metrics, AI-powered insights, and data export capabilities.
Key Features
Financial KPI Engine
Monthly, quarterly, and yearly KPI calculations with historical comparisons and trend analysis
Data Import & OCR
Excel uploads, CSV imports, and receipt image OCR for flexible data ingestion
AI Insights
AI-generated business summaries, anomaly detection, and performance insights
Interactive Charts
Interactive data visualization with drill-down capabilities and custom reporting
Revenue Tracking
Revenue recognition, client grading, recurring revenue analysis, and ARR tracking
Export & Reporting
Export dashboards and reports for presentations, stakeholder communication, and analysis
Challenges Solved
Complex KPI Calculations
Building accurate, efficient KPI engines that handle multiple revenue recognition policies, time periods, and comparison modes required careful data modeling and calculation logic.
OCR Data Quality
Integrating receipt OCR required handling variable image quality, establishing confidence thresholds, and creating workflows for user verification of extracted data.
Data Reconciliation
Reconciling multiple data sources with different formats and timestamps required building intelligent reconciliation workflows that identify discrepancies and guide resolution.
AI-Generated Insights Quality
Ensuring AI analysis is accurate, actionable, and not misleading required careful validation, human-in-the-loop review, and focus on business value over AI novelty.
Business Value
Real-time visibility: Business leaders get a current view of financial performance without waiting for month-end closings or manual reports.
Faster analysis: AI-powered insights reduce manual analysis time from days to minutes, letting CFOs focus on strategy.
Better decision-making: With comprehensive KPIs and trend analysis, leaders can spot opportunities and risks early and make data-driven decisions.
Operational efficiency: Automated data ingestion and analysis reduce manual work and the risk of spreadsheet errors.
Client insights: Client grading and revenue analysis help identify most valuable clients and growth opportunities.
Interested in discussing financial systems, KPI design, or AI-powered analytics?
Get in Touch